Zara J Day

As of 6-NOV-2024 01:30 EST
I don't see anyone pulling this one through here. Pennsylvania looks gone, Wisconsin looks gone, and Michigan might turn around, but she needs all of those to win.

Democrats
224 (47.2%)
Republicans
235 (51.2%)
As of 3-NOV-2024
This is my final prediction with the percentage likelihoods underneath, and all the offsets I had have been removed, so this map is exactly what the early voting indicates. I know this warning will go right over many people's heads, but I'm not saying that this map will be the exact result; I am MUCH more concerned with the likelihoods under the map. Iowa I am shocked to see is still blue after all of this time, even when West Virginia and Kentucky have managed to get to the point I don't need to offset for them to reflect a Trump victory. If Harris wins Iowa, it will be a shock to me, regardless of what the map shows.
My prediction for the biggest pain-in-the-neck award is Pennsylvania, where we will likely not get final results for a few days. Unfortunately, that will give Trump plenty of opportunity to declare himself the victor as he did in 2020 way too early, and if VP Harris pulls ahead in the state and wins it, he will declare the election stolen as he did in 2020. Do not fall for it.

Democrats
276 (48.8%)
Republicans
262 (47.3%)
Alaska: 99% Chance Trump
Alabama: 99% Chance Trump
Arkansas: 89% Chance Trump
Arizona: 99% Chance Trump
California: 99% Chance Harris
Colorado: 62% Chance Harris
Connecticut: 99% Chance Harris
D.C.: 99% Chance Harris
Deleware: 99% Chance Harris
Florida: 99% Chance Trump
Georgia: 90% Chance Trump
Hawaii: 99% Chance Harris
Iowa: 55% Chance Harris
Idaho: 99% Chance Trump
Illinois: 95% Chance Harris
Indiana: 99% Chance Trump
Kansas: 99% Chance Trump
Kentucky: 99% Chance Trump
Louisiana: 99% Chance Trump
Massachusetts: 99% Chance Harris
Maryland: 99% Chance Harris
Maine: 99% Chance Harris
Maine-1: 99% Chance Harris
Maine-2: 94% Chance Trump
Michigan: 90% Chance Harris
Minnesota: 95% Chance Harris
Missouri: 99% Chance Trump
Mississippi: 99% Chance Trump
Montana: 99% Chance Trump
North Carolina: 65% Chance Trump
North Dakota: 90% Chance Trump
Nebraska: 99% Chance Trump
Nebraska-1: 97% Chance Trump
Nebraska-2: 64% Chance Harris
Nebraska-3: 99% Chance Trump
New Hampshire: 99% Chance Harris
New Jersey: 99% Chance Harris
New Mexico: 99% Chance Harris
Nevada: 77% Chance Trump
New York: 99% Chance Harris
Ohio: 90% Chance Trump
Oklahoma: 99% Chance Trump
Oregon: 99% Chance Harris
Pennsylvania: 51% Chance Harris
Rhode Island: 99% Chance Harris
South Carolina: 99% Chance Trump
South Dakota: 99% Chance Trump
Tennessee: 99% Chance Trump
Texas: 99% Chance Trump
Utah: 99% Chance Trump
Virginia: 90% Chance Harris
Vermont: 99% Chance Harris
Washington: 99% Chance Harris
Wisconsin: 72% Chance Harris
West Virginia: 99% Chance Trump
Wyoming: 99% Chance Trump
As of 30-Oct-2024

Democrats
270 (49.3%)
Republicans
268 (47.0%)
Alaska: 99% Chance Trump
Alabama: 99% Chance Trump
Arkansas: 88% Chance Trump
Arizona: 99% Chance Trump
California: 99% Chance Harris
Colorado: 65% Chance Harris
Connecticut: 99% Chance Harris
D.C.: 99% Chance Harris
Deleware: 99% Chance Harris
Florida: 99% Chance Trump
Georgia: 90% Chance Trump
Hawaii: 99% Chance Harris
Iowa: 99% Chance Trump
Idaho: 99% Chance Trump
Illinois: 95% Chance Harris
Indiana: 99% Chance Trump
Kansas: 99% Chance Trump
Kentucky: 99% Chance Trump
Louisiana: 99% Chance Trump
Massachusetts: 99% Chance Harris
Maryland: 99% Chance Harris
Maine: 99% Chance Harris
Maine-1: 99% Chance Harris
Maine-2: 70% Chance Trump
Michigan: 90% Chance Harris
Minnesota: 90% Chance Harris
Missouri: 99% Chance Trump
Mississippi: 99% Chance Trump
Montana: 99% Chance Trump
North Carolina: 64% Chance Trump
North Dakota: 90% Chance Trump
Nebraska: 99% Chance Trump
Nebraska-1: 89% Chance Trump
Nebraska-2: 68% Chance Harris
Nebraska-3: 99% Chance Trump
New Hampshire: 99% Chance Harris
New Jersey: 99% Chance Harris
New Mexico: 99% Chance Harris
Nevada: 82% Chance Trump
New York: 99% Chance Harris
Ohio: 90% Chance Trump
Oklahoma: 99% Chance Trump
Oregon: 97% Chance Harris
Pennsylvania: 54% Chance Harris
Rhode Island: 99% Chance Harris
South Carolina: 99% Chance Trump
South Dakota: 99% Chance Trump
Tennessee: 99% Chance Trump
Texas: 99% Chance Trump
Utah: 99% Chance Trump
Virginia: 81% Chance Harris
Vermont: 99% Chance Harris
Washington: 99% Chance Harris
Wisconsin: 74% Chance Harris
West Virginia: 99% Chance Trump
Wyoming: 99% Chance Trump
As of 25-Oct-2024

Democrats
270 (48.8%)
Republicans
268 (47.7%)
Alaska: 99% Chance Trump
Alabama: 99% Chance Trump
Arkansas: 87% Chance Trump
Arizona: 92% Chance Trump
California: 99% Chance Harris
Colorado: 67% Chance Harris
Connecticut: 99% Chance Harris
DC: 99% Chance Harris
Deleware: 99% Chance Harris
Florida: 99% Chance Trump
Georgia: 90% Chance Trump
Hawaii: 99% Chance Harris
Iowa: 99% Chance Trump
Idaho: 99% Chance Trump
Illinois: 90% Chance Harris
Indiana: 99% Chance Trump
Kansas: 99% Chance Trump
Kentucky: 99% Chance Trump
Louisiana: 99% Chance Trump
Massachusetts: 99% Chance Harris
Maryland: 99% Chance Harris
Maine: 99% Chance Harris
Maine-1: 99% Chance Harris
Maine-2: 54% Chance Trump
Michigan: 90% Chance Harris
Minnesota: 90% Chance Harris
Missouri: 99% Chance Trump
Mississippi: 99% Chance Trump
Montana: 99% Chance Trump
North Carolina: 60% Chance Trump
North Dakota: 90% Chance Trump
Nebraska: 99% Chance Trump
Nebraska-1: 79% Chance Trump
Nebraska-2: 73% Chance Harris
Nebraska-3: 99% Chance Trump
New Hampshire: 99% Chance Harris
New Jersey: 99% Chance Harris
New Mexico: 99% Chance Harris
Nevada: 81% Chance Trump
New York: 99% Chance Harris
Ohio: 90% Chance Trump
Oklahoma: 99% Chance Trump
Oregon: 98% Chance Harris
Pennsylvania: 55% Chance Harris
Rhode Island: 99% Chance Harris
South Carolina: 99% Chance Trump
South Dakota: 99% Chance Trump
Tennessee: 99% Chance Trump
Texas: 99% Chance Trump
Utah: 99% Chance Trump
Virginia: 77% Chance Harris
Vermont: 99% Chance Harris
Washington: 99% Chance Harris
Wisconsin: 74% Chance Harris
West Virginia: 99% Chance Trump
Wyoming: 99% Chance Trump
As of 23-Oct-2024

Democrats
252 (45.3%)
Republicans
286 (43.7%)
As of 18-Oct-2024

Democrats
268 (3.9%)
Republicans
270 (3.2%)
No data
150
The pale states like OK and OR (besides NE-D1) are states where there is no data or the data is not helpful for projections, and thankfully, all of those states are ones where the outcome is pretty much a given. Besides that, the rest is all based on the early voting data offset by how 2020's early voting was off from the final results. This corrects a lot of the issues with states like Iowa and Kentucky being so off. It turns out that early voting in those states is very heavily skewed toward Democrats.
Keep in mind that many states have not reported a high amount of early votes yet. Illinois is at 519,292, which is reported out of an expected 4.5 million. Pennsylvania, a very important state, is only at 787,900 reported out of the expected 2.5 million. West Virginia has only 7,511 votes reported.
If we flip West Virginia and Illinois to be the expected leanings, the results are Harris 283, Trump 255
Georgia: 76% Chance of Trump Win
Michigan: 72% Chance of Harris Win
Ohio: 99% Chance of Trump Win
Texas: 99% Chance of Trump Win
Virginia: 80% Chance of Harris Win
Wisconsin: 99% Chance of Harris Win
As of 17-Oct-2024

Democrats
265 (3.0%)
Republicans
117 (2.2%)
No data
156
Double the votes included, double the accuracy. As of right now, here is the map with early voting leaning estimated. I will repeat what I've said before. For some of the states, the calculations are based on how many Dems voted and how many Reps voted, and for others, it's where votes are coming from. We have no clue if Democrats are voting for Harris or Republicans are voting for Trump, only confidence enough are staying consistent with their ID to make these guesses.
Here are the numbers for the 11 states of interest. Yellow means they don't have registration by party so I can only use which counties have reported votes.

Yellow states mean I also have a margin of error, which I made 90% certain of. In case you are unaware, the Margin of Error (MoE) is how far off the presented percent might be. So, in the case of Ohio, I believe Trump will receive between 5% and 20.2% more than Harris. That means the average is 12.6%, with a MoE of 8%. Most states have a MoE that is too small to shift the tide in another person's favour. The exception here is VA, where Harris could lose. If you want a certainty of 95%, double the MoE, and you have approximately that, though the number ranges get too wide to be useful, and you're hedging your bets on extremes.
As of 13-Oct-2024

Democrats
242 (1.5%)
Republicans
132 (1.1%)
No data
164
One of the things I plan to do after this election is take the data on how off the early voting data was from the results. West Virginia is going to vote for Trump and Jim Justice, yet the early voting shows a lot more Democrats have voted than Republicans. Likewise, Iowa is unlikely to vote for Kamala, yet Democrats have shown up much more than Republicans. 2026, I plan on implementing the same offsetting to Early voting that I have on the polling, thus making this map much more useful as a predictive measurement.
As of 9-Oct-2024

Democrats
258 (1.1%)
Republicans
54 (0.7%)
No data
226
Not a massive change. I took off states with zero data as I think I made some mistakes before. Things still look good for Harris overall.
As of 8-Oct-2024

Democrats
189 (0.90%)
Republicans
48 (0.60%)
No data
254
Not a massive change. I took off states with zero data as I think I made some mistakes before. Things still look good for Harris overall.
As of 5-Oct-2024

Democrats
226 (0.59%)
Republicans
86 (0.41%)
No data
226
This map is my first attempt at interpreting early voting data. Green are the states that don't have early voting data available yet, and the projections are based on the number of democrats and republicans who have voted in each state and assuming registered Dems will vote for Harris and registered Republicans will vote for Trump. Also, NPA and third-party voters had their votes split with a formula between Democrats and Republicans.
States like Virginia and Wisconsin, where voters don't register parties, had the calculations done by how each county individually votes. Between 84.5% and 89.3% of Petersburg County, VA votes Democrat, while between 78.8% and 87.7% of Scott County votes Republican. These counties and the current early votes in each indicate that at this time, Virginia might go between 8.3% for Trump and 11.6% for Harris hence why Virginia is light blue.
As you can see, there isn't enough data in enough states to even approximate a winner or suspected winner, which is why Illinois is red, and Nebraska is blue. Also, keep in mind that Democrats tend to vote early. Still, the fact that democrats are mobilized in states swing states like Pennsylvania.
The percentages are based on the expected number of votes. In the last election, about 150 million votes were cast nationwide. So far, only about 1.5 million people have been cast for 2024.
As of 3-Oct-2024
Trump/Vance
287 (45.2%)
Harris/Walz
232 (48.0%)

This map shows the current state of the 2024 Presidential Election based on RCP averages (October 3, 2024).
As I continue to experiment with how to best model the suspected outcomes of this and future elections, I am struck by how little changes to the model can have big impacts. Of note, whether I include all polls or just verifiable ones has been on my mind, and I've experimented with doing that so lukewarm results. We are also at a point in the election cycle where votes are being cast, and I'm wondering if the data from that is going to be useful in these predictions.
According to Dave Trotter of Voting Trend in his latest video about early voting momentum (Click here to open it), the early voting in Wisconsin is showing a high probability of going Democrat if his models are correct. I don't know what his model is or how it calculates that, but I do know that it's based on real numbers of votes and I can't help but agree that voting data is more valuable than polls. I might be willing to do more research into how his Nowcast modeling works and try to incorporate something like that myself, but I don't want to over complicate what it already a difficult process on my end. If I do use it, I will credit him naturally, but for now, the above map is still my prediction if the election were held today.
As of 1-Oct-2024
Trump/Vance
306 (45.3%)
Harris/Walz
232 (48.0%)

This map shows the current state of the 2024 Presidential Election based on RCP averages (October 1, 2024).
The debate between the two major VP candidates is tonight, and I think it is appropriate to share the state of the race at this exact moment because it's been giving me the willies for the last few days and demonstrates how close we are to a Trump presidency is people don't come out to vote for Kamala.
As you can see, my model has Pennsylvania and Michigan leaning toward Trump by 0.1%. Now, clearly, that is well within the margin of error, and we shouldn't start plotting our graves, but people seem to be under the impression Harris is on the right side of the increasing coin flip this election might be. Many maps show that Wisconsin is going for Harris, and I don't get why. The polling has Harris only leading by 0.4%, and that is before correcting for the SIX points polls in Wisconsin, which tend to be in favour of the Democrats.
Now listen, I get that Georgia, Michigan, and Pennsylvania are all within 0.2% of being for Harris, and maybe she will win all three and have 282 EVs. We can all laugh if that happens about how Trump almost looked like he was poised to take the White House again. But I'm not laughing right now, and we're 35 days away from Election Day. The debates tonight will NOT have a tangible effect on the results, but maybe the positive news coverage of it will keep Kamala's momentum all the way to the finish line. We'll see.
As of 27-Sep-2024
Trump/Vance
272 (46.0%)
Harris/Walz
266 (49.2%)

This map shows the current state of the 2024 Presidential Election based on RCP averages (September 27, 2024).
For some reason, RCP is no longer aggregating its multicandidate polls. So, this map is based on the two-way polling between Trump and Harris. It's basically the same, but now the lean Harris in Georgia is a tilt Trump, and tilt Trump Michigan is a tilt Harris. There are other changes, but the colours are the same. This two-way polling also requires that the popular vote be calculated differently. I don't want to give numbers inflated to fill 100% because it's unlikely that 52% of Americans will vote for Harris, so the new popular vote predictions are based on the raw data.
2016: Clinton 48.2%, Trump 46.1%. Trump won.
2000: Gore 48.4%, Bush 47.9%. Bush won.
A Democrat candidate for President needs more than 50% to win, most likely.
6 maps to visualize the election this year.
For full explanations, go to 13 Aug.
STATES WITHIN 15 POINTS

Toss-up: 272 Harris: 151 Trump: 115

Trump: 387
Harris: 151

Harris: 423
Trump: 115
STATES IN PLAY (within 5 points): AZ (11), GA (16), ME2 (1), MI (15), NC (16), NV (6), PA (19), VA (13)

Toss-up: 97 Harris: 213 Trump: 228

Trump: 325
Harris: 213

Harris: 310
Trump: 228
As of 25-Sep-2024
Trump/Vance
271 (47.4%)
Harris/Walz
267 (50.7%)

This map shows the current state of the 2024 Presidential Election based on RCP averages (September 25, 2024).
As of 16-Sep-2024
Trump/Vance
271 (48.1%)
Harris/Walz
267 (50.7%)

This map shows the current state of the 2024 Presidential Election based on RCP averages (September 15, 2024).
As of 10-Sep-2024
As of 8-Sep-2024
Harris/Walz
282 (50.0%)
Trump/Vance
256 (48.1%)

This map shows the current state of the 2024 Presidential Election based on RCP averages (September 8, 2024).
Here is the map with all states adjusted how off they were in 2020. As you can probably notice, there is not a real big shift from the smaller map on the 5th, but I am more confident that this is more realistic than the bigger map from the 5th.
As of 5-Sep-2024
Harris/Walz
277 (50.4%)
Trump/Vance
245 (48.1%)


This map shows the current state of the 2024 Presidential Election based on RCP averages (September 5, 2024).
Below is a map I made today where last year's polling in key battleground states missed the mark. For example, last year, the polling had Trump up +1 point in Georgia, and instead, Biden won it by +0.3. This means the polls were off by +1.3 in Trump's favour. Wisconsin, in 2020 and 2016, polled 6 points bluer than the real results. Other states like Nevada and Pennsylvania had polling that exactly matched the real results. In some of the battleground states, the polls are in the margin of error for either Harris to flip or Trump to flip. One thing I noticed that half surprised me is that the polling for Maine CD2 is basically completely unreliable as last election the polls had Biden +1.3 and Trump won it by +7.7. This means that the Maine +5.4 for Harris is probably way off like most pollsters could have predicted. Still, it is bizarre that the polls are so off there. I'm not sure if I should switch permanently to using the offset, but maybe as a smaller graphic, it could sit as a reminder that polling isn't perfect.
I only did this to the seven key battleground
states. It isn't worth doing it for places like
Florida and Texas that, while historically
swing states, have been so steady red
that it is unlikely to be off in the
polling enough to matter.
Harris 282 Trump 256

As of 31-Aug-2024
Harris/Walz
287 (50.1%)
Trump/Vance
245 (48.2%)

This map shows the current state of the 2024 Presidential Election based on RCP averages (August 29, 2024).
It has been about a week, and it is still too early to really know how Kennedy's endorsement of Trump will affect the race. That being said, he is still going to be on the ballot in plenty of states, including swing states like Wisconsin and North Carolina, which could make a difference. Still, he has removed his name from plenty of other ballots, so this map is a reflection of the map with the best information available to me today.
Some states may flip red like the map on the 22nd, but it is also possible that a lot of Kennedy voters will still vote for him or stay home. Kennedy was a unique figure in the race, and it isn't obvious that people who were planning to vote for him weren't protesting the two-party system in general and didn't want to vote for Trump. The DNC also concluded a week ago, so Harris is certainly seeing that post-convention boast. Of note, the latest polls have Harris with a slight lead in North Carolina and Nevada is tied. Sixty-six days is a long time, though early voting is right around the corner and mail-in ballots are being printed as we speak, so in some ways, the time for Trump's campaign to leave this moelleuse is tight.
I'm adding my model's projection for the popular vote. Kennedy is right now projected to get less than 1 percent of the popular vote. I don't see any possibility of Harris losing the popular vote. It is more likely that she will lose the electoral college and win the popular vote than for her to lose the popular vote at all.
As of 22-Aug-2024
Trump/Vance
286
Harris/Walz
252

This map shows the current state of the 2024 Presidential Election based on 2-way polls (August 22, 2024).
As promised yesterday, Kennedy's pending dropout made a mess of the map as tight Harris states are now tight Trump states. This was always the unlining reality, which is why I've been very deliberate in saying Harris needs to campaign in key states until the end, and every vote matters. Trump shouldn't get too comfortable, either.
Of note, Arizona, North Carolina, and Pennsylvania tilt Trump in the two-way polling.
As of 21-Aug-2024
It's Rob-over
Robert Kennedy Jr. is reportedly planning to drop out now that he no longer a decade younger than the major party candidant but now a decade older than one of them. It has been no secret that he is looking for an exit strategy, especially now that his preferred candidate, Trump, is the one he is pulling voters from the most. His running mate, Nicole Shanahan, even said as much yesterday in an interview with Tom Bilyeu.
Kennedy is already going to be on the ballot in 27 states with another 19 states awaiting certification. Dropping out would possibly give Trump a boost in key swing states such as Pennsylvania and North Carolina where Kennedy's absence puts Trump ahead. It's clear his heart is not in trying to give voters a third choice, but in trying to get Trump re-elected. I will put out a map tomorrow with the two-way polls because West and Stein have been polling at 1s and 0s in most states. They might see a slight boost actually as a lot of the double haters flood there, but expect Trump's electoral chances to see an increase in the coming days.
Harris/Walz
282
Trump/Vance
240

This map shows the current state of the 2024 Presidential Election based on either 2- or 5-way polls depending on who has ballot access for each state (August 21, 2024).
A huge explosion of polling was just released for non-swing states, giving us a clearer picture of what the election could look like. This might end up being the last time I differentiate Biden and Harris numbers using the dark blue for Biden because, with this explosion, the states left are +15 for Trump or Biden. If DC became Republican with Harris as the nominee, I'm sorry for lying in the reporting. This will make things easier. Other than that, the only changes worth noting are that Maine-at-large is safe Harris, Maine's 2nd is likely Harris, and Arizona's polling shifted from lean Harris to tilt Harris.
As of 20-Aug-2024

Harris/Walz
281
Trump/Vance
241

This map shows the current state of the 2024 Presidential Election based on either 2- or 5-way polls depending on who has ballot access for each state (August 20, 2024).
Two MASSIVE updates. 1. Arizona, which only a month ago was +5 Trump, is now +1.1 Harris and 2. North Carolina is tied. Flips can not be understated. Arizona and Missouri are now scheduled to have protections of the right to abortions up until viability, around 24 weeks, which was the policy for Roe v. Wade, on the ballot in November. This may very well cement Arizona as a Harris state as it is expected to drive voters out to confirm their rights. Adding Arizona to Harris' column will be a massive sigh of relief as the lead for her migrates away from a 50, and she is being favoured to win.
As for North Carolina, the quick-shifting of North Carolina towards Harris is a signal of the overall mood of the country that has gone from Trump +1.2 in the two-way polling on August 1st to Harris +1.2 today. I almost can't believe North Carolina is tied in the aggregate of polls. It's not something we've seen since 2008, when Obama won the state in his first election. Trump's team must be worried about his chances, especially when he is continuing to campaign against the lame-duck President instead of his opponent and rambling about crowds, even Fox News broadcast being AI-generated. Obviously any lead gained so quickly can be lost so quickly, but it's important to note that Harris's gains are a result of people getting to know her and her campaign in the brief time since President Biden bowed out. Trump is a known entity, and one who is failing to present an adequet pressure to stop, much less reverse, the momentum.

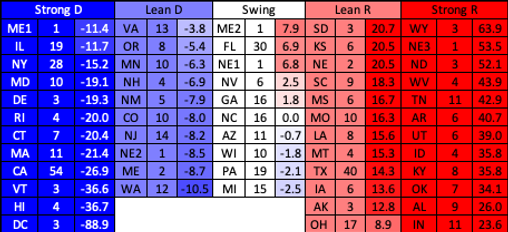
Also, I've noticed that once again, a trend has re-emerged asking how Democrats win elections when county maps with results have so much surface area coloured red. The answer is that land doesn't vote; people do. Wyoming is the 9th largest state in the union, and yet the lowest population count, about half that of Rhode Island, is the smallest state, which is only 1,033 square miles. When you look at a map with massive red states and tiny blue states, it makes sense that you could intuitively think the country is mostly Republican, but that is just not the case.
Above is a grid that has each state's electoral votes, sorted by the polling for Harris or Trump. The line in the middle is the 269 marker. In order to win, either candidate needs to spill over into the other side of the grid, which Harris is currently doing with one vote from Wisconsin and all of Arizona. If you like this feature, I can include it from now on. Personally, I know it helps me have an intuitive sense of the race, seeing the blue or the red recede or grow. It's a pain to update, though, because Excel makes me move the cells around instead of updating their placement.
As of 14-Aug-2024
Harris/Walz
270
Trump/Vance
257
This map shows the current state of the 2024 Presidential Election based on either 2- or 5-way polls depending on who has ballot access for each state (August 14, 2024).


As of 13-Aug-2024
5 maps to visualize the election this year. (Keep in mind, two of them are almost impossible).
I wanted to take a look at the electoral map and paint an image first of the map with swing states highlighted in yellow so we can get a real look at what states either candidate has even the remotest chances of winning. Some of these are pipe dreams for Trump or Harris, but I figured if something outrageous happened in the next 84 days, it would be theoretically possible for them to be in play. If you think for a moment I'm suggesting Harris has a 50% chance of winning Texas or of Trump winning New Mexico, you misunderstand this exercise.

Toss-up: 232 Harris: 181 Trump: 125

Trump: 357 Harris: 181
This second map is what might have happened with Biden still in the race, a.k.a. Trump runs the board and cleans sweeps the whole thing. We haven't had a landslide like this from a Republican president since 1988 when California was still winable by Republicans.
This third map is probably the strangest conceivable given the politics of the day. The idea of a Democrat winning Texas is the definition of a pipe dream, and yet elections over the past decade shows a quiet pool of support for Democratic candidates. Still, this is just not a possibility in the polarized world we live in.

Harris: 413 Trump: 125
Now that we've had some fun, let's get down to realistic maps based on the polling available for the 2024 race. The map on the left is optimistic map of what Kamala Harris could win based on the assumption that polls are favouring Trump by about 5 points. The map on the right is the optimistic map of what Trump could win based on that same assumption inverted. Either of these are possible, which means that no one should be comfortable just because polling puts one candidate ahead of another in a state. The 2016 election can easily be characterized by bad polling leading hundreds of main stream reporters to confidently declare that Sec. Clinton had 90% odds of winning then finding out the "blue wall" (Mi, Pa, Wi) were in play.
STATES REALISTICALLY IN PLAY: AZ (11), GA (16), MI (15), NC (16), NV (6), PA (19), VA (13), WI (10)


Harris: 319 Trump: 219


Trump: 325 Harris: 213
The real results will likely be somewhere between these two maps with these being, as stated prior, optimistic. These are the maps the campaigns are likely aiming for to ensure victory is definitive. The last thing anyone wants is a nail-biter or 269 tie. See the posts below to see what current polling indicates.
This video goes over the 2024 election, explains a lot of how I make these posts and maps, and even serves as a time capsule of what polling indicated 83 days out from the election. If you have 30 minutes to kill, check it out.
As of 10-Aug-2024

Harris/Walz
270
Trump/Vance
262
Above is the map with Wisconsin reflecting its now firmer lean for Harris. I also added a darker colour to the states Biden and Trump were leading prior to Biden dropping out that don't have polls yet.
Meanwhile, according to RCP's Betting Odds (10AUG24), Kamala Harris is the favoured to win the Presidency. Her lead in Wisconsin is stronger; the numbers are there for her to eke a victory, if not gain more electoral votes from states like Georgia and Nevada. We haven't even gotten to the Democratic Convention which usually enhances the polling for the Democratic candidate. No reason to take the foot off the gas yet, but this is the right direction.

As of 8-Aug-2024
Harris/Walz
109
Trump/Vance
70

As of 7-Aug-2024

Presidential Betting Odds from RCP as of August 6, 2024.
This is a condensed version of the chart with only the major events highlighted and presented on the map. It clearly shows the direction of predictions for who will be the next president, with former President Trump sitting at 3.2 points higher, but VP Harris is closing the gap every day. The former President peaked at 66.2% right before the RNC and a few days after the assassination attempt. Do not get that twisted, though, because it was certainly the swapping of the Democratic nominee that reversed the race.
Today, Minn. Gov. Tim Walz has been tapped for VP by Harris, a popular and progressive governor whose two terms as governor brought the state reproductive health, paid leave, child tax credits and gun safety (Politico, 2024). This decision by the Vice President has gained her a substantial boost in favourability by swing and left-leaning supporters who worried that picking Gov. Shapiro of Pennsylvania, whose comments on college protesters and Isreal indicated at best-mixed feelings about the legitimacy of their war effort, would be an indication that VP Harris is not serious about ending the bombing of Palestine. Gov. Walz, on the other hand, has advocated for the distinguishing of Palestine and Hamas, for humanitarian aid to Gazans, and a two-state solution. Overall, while it is not my opinion that Walz will be a deciding factor for Americans in November, his nomination helps to frame the election around moving forward as a country, not backward.
Feel free to compare this to the map from June 19th below.
Reference: Daniels, E., Schneider, E., Otterbein, H., & Cadelago, C. (2024, August 6). Why Kamala Harris chose Tim Walz. Politico. https://www.politico.com/news/2024/08/06/why-kamala-harris-chose-tim-walz-00172834

Harris/Walz
109
Trump/Vance
66
As of 31-Jul-2024
This map shows
the current state of
the 2024 Presidential
Election based on
either 2- or 5-way polls
depending on who has
ballot access for each
state (July 31, 2024).
This is the very first map I've made since VP Harris took over as presumptive nominee, and I wanted to wait a few weeks until we had polling in most of the battleground states.
The map is a very good sign for the Harris Campaign as she is now leading in Michigan, Pennsylvania, and Maine and competitive in Georgia, North Carolina, Wisconsin, and Arizona. All she would need to win in Nevada and Wisconsin, and she would win. If she could flip any or all of the light red states, it would be a landslide. On top of that, she has made several blue states more secure, such as Virginia, Minnesota, and New Hampshire. We will need to see more polling from other states like Florida or Ohio to see if she has more avenues to secure a victory, but for the first time, I believe the odds are higher that the Democratic candidate will defeat Trump in November and we can officially say at the very least that Biden dropping out was a good decision.
Feel free to compare this to the map from July 12th below.

IT'S JOEVER
The long-awaited day when President Biden would make the right decision to leave the race for a second term as President has happened, and it is still unclear who will replace him at the top of the ticket, though realistically, the spot is Harris's to lose. My whole spreadsheet is getting nuked, but I will gladly rebuild it over the next few days to reflect the state of the race as we know it. In the meantime, I will continue to track Biden's approval numbers as I have with all lame ducks and will track the betting markets until the end of the convention or whenever the replacement is decided. We can breathe a sigh of relief that perhaps we can have a shot in November.
As of 19-Jul-2024

This chart is based on the betting markets for who will be the next president with important markers for key events from RCP (July 18, 2024).
Their betting markets are not perfect in that it's just the opinions of a few people on who is likely to win the presidency based on whatever criteria they choose to use. That being said, it is very receptive to changes and events, as displayed by the labelled spikes. Notably, the past few weeks have seen VP Harris overtake the President a number of times as the debate over replacing Biden before the convention should occur. If you notice, the likelihood of Biden winning in November is an Earth-shattering 4.7% after insiders allege the President is considering dropping out as late as Sunday, July 21st. It is hard to tell whether he will do it, but the fact that his VP is considered to have five times as much of a chance of winning the Presidency than him when she has yet to even indicate she would be interested in doing such a thing is not a good sign for his campaign.

This chart is a comparison of the polling differentials of the major parties' candidates, with the lighter tails on the right being the final differential in the election. Polling comes from RCP (July 19, 2024).
One of the first things you might notice upon examining this chart is that the purple zone is not around 0 but rather around 2. That is because the Presidential election is NOT based on the popular vote, but rather the electoral college, which disproportionately favours small conservative states like Wyoming to massive liberal states like New York, meaning that when looking at polling for the popular vote, democrats need a plus at least 3 to be in a safe window for victory. The green line was the 2016 election, where polling going in was +2 for Clinton, which was spot on for the final multiple. Yet, she did not win because she did not win enough of the Electoral College. The purple zone thus represents the world where a Democrat wins the popular vote but loses the election: the Goldilocks zone of nonsense.
As of now, Joe Biden is polling at -3, a significant 6 points away from clearing the Goldilocks zone (the light blue tail is based on 2020 voter turnout combined with 2024 state polling). In the last 5 elections, the biggest jump from final polling to the election results was the 2012 campaign for Obama's second term where he got 4 more than expected. This might sound promising, until you realize that that year's polling played hopscotch with the goldilock zone the 6 months preceding election day while Biden wasn't polled above Trump once this entire year. In fact, no Democrat since the start of RCP polling in 2004 has hit -3 points and won the election. This is a critical point to understand as it underscores the significant challenge Biden faces. It is not too late for Biden to drop out and have Harris take over the campaign. It is easier for a camel to go through the eye of a needle than for Biden to win this election with such low approval or confidence from voters.
In the wake of the attempt on President Trump's life today, 13 July 2024, I think it's important that I make abundantly clear that I condemn violence of any kind against political opponents. This is the United States of America, a democracy where politics are battled rhetorically, not with weaponry. I don't care if you are a Democrat, a Republican, or anything right or left of those parties; the only appropriate response to this attack on democracy is to wish Trump a speedy recovery and to mourn the death of an innocent spectator and the injuries of others whose only crime was being passionate enough about politics to attend a public rally.
This attack does not change how I feel about the former President's policies and actions in his first term. I don't see him any differently today than I did on the 12th. I will continue to fight for what I believe is right, which means pushing for Trump to be defeated in the election, but I'd rather Trump win in November than see Melania become a widow and his five kids become fatherless, and I'm not ashamed of that.
As of 12-Jul-2024

This map shows the current state of the 2024 Presidential Election, comprised entirely of poll results from RCP (July 12, 2024).
Before I get into the map, I would like to start by talking about the most embarrassing moment in American history: the Presidential debate that happened 15 days ago. While Donald Trump was spending his time lying about everything from the economy to his bungling of the COVID-19 pandemic, President Biden was hoarse, aloof, and telling lies by mistake because he couldn't string a sentence together without mistaking billionaires with trillionaires and abortion rights with illegal immigration. While the map hasn't changed very much, the spirit around this election truly has. There is a loud and spirited push by voters, TV pundits, and elected officials to replace Biden with another candidate. This conversation is occurring, of course, after the primaries, which means the only way to get a new nominee would be for him to choose to be replaced before the convention in August.
Most of this is already well understood by people reading it. The only statement I will make on this matter, one representing solely my opinion and not that of organizations I work for or am affiliated with, is that the President seems to feel he is the only one capable of defeating Trump, a mentality that reflects a rather low opinion of his fellow Democrats and an extremely inflated ego that doesn't help his case of being less dangerous than Donald Trump. I didn't want him to run for a second term nor support the DNC effort to ensure candidates running against him become persona non grata, which ensured Biden was uncontested in his primary win. As of this point, the President has made a number of public statements clearly declaring his commitment to run, meaning that my analysis of the 2024 race will be with the assumption that he will be on the ballot in November and, at least in my state, the only one standing in the way of a felon and self-professed wannabe dictator getting a second chance, this time with a plan to overhaul the government as laid out in Project 2025. With that said, here is the current polling for the 2024 election.
Michigan has gone back to being a tie, something that could be positive news for Biden, except that Wisconsin has gone from tilt Trump to lean Trump. I don't want to overstate the level of concern left-minded people should have, but even if Biden wins Michigan, he also needs 31 electoral points more than that, so possibly Wisconsin, Pennsylvania and Maine, which is the most likely combo or some other combo.
Feel free to compare this to the map from June below.
As of 22-Jun-2024

This map shows the current state of the 2024 Presidential Election, comprised entirely of poll results from RCP (June 22, 2024).
A few changes to the map include which states may have certain third-party candidates. Quite a few states are now going to allow Kennedy now that he has a VP pick, but he is still miles from winning at this point.
The first thing worth noting is that if Maine's At-large flipped to Trump, it would give him 2 more electoral points. Michigan is more in play than before, so Missouri, of all places. New Hampshire is also more in play, but that is a swing state, so it makes some sense. Other than that, some states like Utah, Louisiana, Iowa, Alabama, and to some degree North Carolina all become concrete in their support of Trump. Overall, it appears becoming a convicted felon has had no effect on Trump's chances in November.
At this point, Biden's best move is to try and win back Maine AL as well as pull over Michigan, Wisconsin, and Pennsylvania. If he does, he will have a second term. Trump's job is pretty simple, don't be so polarizing in the next 4 months that people shift away from you, which I'd argue he is doing fairly successfully. He isn't making a lot of noise or saying outrageous things, so all eyes are on Biden for his gaffs and poor handling of the Palestinian genocide. After next week's debate, it is possible we can see a shift, but frankly I doubt it. Outside of people aware enough about politics that they almost certainly have decided already, nobody will be tuning in for a random debate in June. Prove me wrong, America.
Feel free to compare this to the map from April below.
In a video published to the Allan Lichtman Youtube page, he outlined his actual position on the 13 keys and how they help or hurt Joe Biden. Turns out in my prediction of his position was off only in the field of Major Policy Change. He says four of the keys are still in play that can shift the election to favour Trump, but as of right now he predicts a sizable victory for Biden.

As of 28-Apr-2024

This map is the current state of the 2024 Presidential Election comprised entirely of poll results from RCP (Apr 28, 2024).
Biden's polling in the key state of Michigan has increased to the point that the state is sitting at a tie. I marked it as leaning toward Biden only because that is the trajectory. This is good news for the Biden campaign early in the year because he will need the area called "the Blue Wall," Wisconsin, Michigan, and Pennsylvania, to win in November.
His support in those states waxes and wanes month to month. An average of 6.4 percent of people there report to have not decided who to vote for which is within the margin between Trump and Biden in all of those states plus about 29 other states. Until we are much closer to the election and people are more willing to choose between Trump or Biden, no conclusion can be made on what the outcome of the 2024 election might be.
Feel free to compare this map to those below.
As of 3-Apr-2024

This map is the current state of the 2024 Presidential Election comprised entirely of poll results from RCP (Apr 3, 2024).
Biden has been closing the gap a little in the battleground states of Wisconsin and North Carolina. He will need Michigan, Pennsylvania, and Wisconsin to flip by November entirely, plus a state like Nevada, North Carolina, or Georgia to win the election. Polling has indicated that undecided voters tend to lean toward Biden 2 to 1, which could shift the tide for Biden in these states, but it's not good for Biden if he is relying on people who are also considering Trump.
Feel free to compare this to the Pre-SOTU projection below.
In The Keys to the White House, Lichtman and Keilis-Borok developed a way to predict presidential elections by looking at 13 factors in how voters decide who to vote for. As recently as March 7th, Lichtman has said Biden is likely to win based on this system. Here is my best approximation of why he might believe that. I've marked True of 8 of these factors, meaning several things would have to go wrong for Biden to lose.

The Charismatic factors are based on his ratings in 2020 about the same candidates and the foreign/military factors are based on 59.4% disapproving of his foreign policy and 52.3% disapproving of his handing of Ukraine (RCP).
This graph is the approval numbers of every President in the last 44 years. Joe Biden is currently in Bush (41) territory and more than 5 points below where Trump was at this time four years ago. Considering this is a rematch with Trump, this doesn't bode well. His high point was during the pandemic and his low was around the the Dobbs decision.
Reagan53%37% Bush 4160%28% Clinton56%38% Bush 4349%45% Obama48%47% Trump43%53% Biden44%52%

As of 7-Mar-2024


This map is the current state of the 2024 Presidential Election comprised entirely of poll results from RCP prior to the State of the Union (Mar 7, 2024).
The popular vote was constructed from multiplying state vote counts in 2020 by the percentages of the state polling for candidates qualified to be on the ballot. Despite Kennedy getting 13% of the vote in national polling, as of 10 March, there is not method by which people can vote for him in 42 out of 51 contests.
Biden is well within the realm of winning Wisconsin, Michigan, and Pennsylvania and needs to do so if he is to win. If he can turn another state like Nevada, North Carolina, or Georgia, he can give himself a victory. Otherwise, he would be risking this going to the Republican leaning House of Representatives for them to choose the President.
Not a massive change. I took out the states with basically no polling and